
July 2025 Market Overview
By mid‑July, several major indices were at or near record highs and volatility remained subdued, but sentiment turned late in the month after a new round of US tariffs, while weak jobs data on 1 August added further pressure. US inflation increased to 2.7% y/y (vs. 2.6% est.), while the Fed left rates on hold. Treasury yields drifted lower on rising Fed-easing expectations, while the dollar traded unevenly. Earnings season brought sharp reactions, with S&P 500 firms missing estimates suffering their steepest underperformance since 2017, while European Stoxx 600 companies endured their harshest punishment in decades.. Locally, the SARB cut rates by 25 bps and shifted its inflation target focus to the bottom of its 3-6% band.
US Payroll Revisions Flip the Narrative
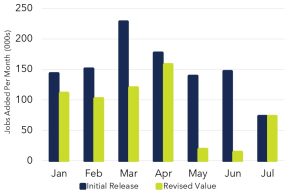
The July jobs report shook markets, not so much because of the modest 73,000 payroll gain versus expectations of 104,000, but because of massive downward revisions that erased nearly all job growth from May and June. What had seemed like steady hiring just weeks ago now looks almost flat, with June cut from 147,000 jobs to only 14,000. The unemployment rate climbed to 4.2% as participation slipped again, underscoring that demand for workers is fading faster than supply. This sudden shift in the labor picture has investors betting the Fed could move on rate cuts sooner than December, with markets now pricing in a September cut.
Latest Tariff Landscape
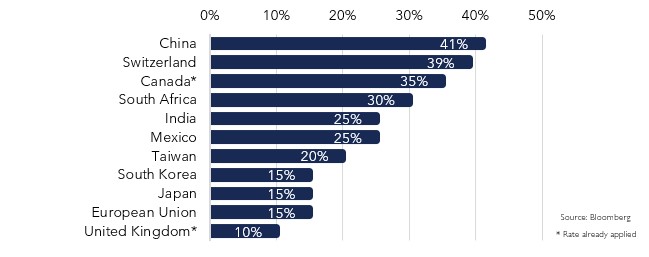
These tariffs cover just a few key countries and reflect headline reciprocal rates effective on 7 August, under the 31 July executive order. While they provide a high‑level view, the tariff landscape is more nuanced, shaped by exemptions, compliance rules, and pending reviews. Actual duties may differ by product due to exemptions (e.g., USMCA compliance for Canada/Mexico), sector‑specific surcharges such as the 50% Section 232 metal tariff, and the EU’s framework, which ensures a minimum 15% duty rather than a flat rate. China’s ~41% rate reflects layered measures, including reciprocal tariffs and additional Section 301/232 duties. The administration is also reviewing potential tariffs on semiconductors and pharmaceuticals, though none have yet been implemented.
Credit Default Swaps (CDS)
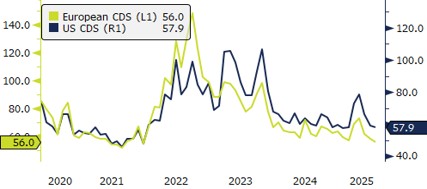
Chart detail: European Credit Default Swaps (CDS) represented by the SNRFIN CDSI GEN 5Y Corp. US CDS represented by CDX IG FIN CDSI GEN 5Y Corp.
Credit risk eased in July, with European CDS falling to 56.0 (from 58.7 in June) and US CDS to 57.9 (from 59.1), keeping spreads near multi‑year lows. The calm reflected typical summer seasonality, as thinner liquidity often dampens volatility and price swings. Still, the calm did not fully carry into August, with early signs pointing to volatility creeping back into credit markets.
Performance
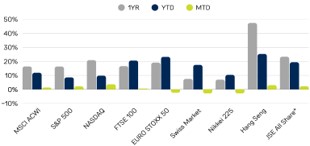
* JSE All Share Index, shown in ZAR
Global equities were mixed in July. US markets outperformed, with the S&P 500 up 2.2% and the Nasdaq gaining 3.7%, helping lift the MSCI ACWI by 1.4%. In contrast, European and Swiss equities lost ground, with the Euro Stoxx 50 down 2.4% and the Swiss Market off 2.9%. Japan’s Nikkei also fell 2.9%.
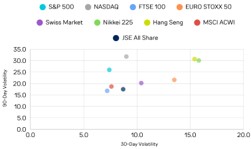
Equity market volatility eased further in July, with thin summer trading and resilient risk appetite keeping markets unusually calm despite ongoing tariff headlines. The US saw notable declines, while European and Asian markets held in the mid‑teens. However, the calm ended at month‑end, as weak US jobs data and renewed trade tensions sent volatility sharply higher moving into August.