
August 2024 Market Overview
In August, global financial markets experienced mixed performance. U.S. equities showed modest gains driven by tech sector strength, while European markets remained flat amid concerns over economic slowdowns. Asian markets were volatile, influenced by fluctuating Chinese economic data and regulatory shifts. Bond yields rose globally due to inflation fears and potential rate hikes. Commodities saw declines, particularly in oil, as supply concerns eased. Emerging markets faced pressure from stronger U.S. dollar and geopolitical tensions, impacting investor sentiment.
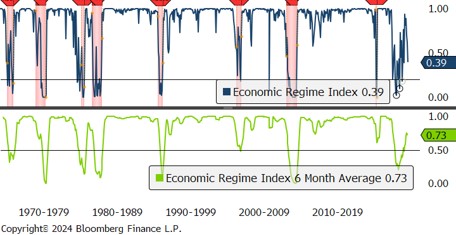
The above graph shows a recent decline in the Economic Regime Index, indicating increasing economic uncertainty. Historical patterns suggest potential recessionary signals when the index dips below the 0.4 level, as highlighted by the shaded regions and the current 0.39 reading.
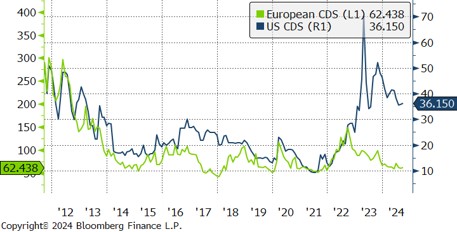
The above graph shows declining credit risk in both European financials (64.446) and U.S. entities (35.020) since their peak in 2022. This suggests improving market conditions and reduced perceived default risk for both regions, indicating a stabilising financial environment.
INTERESTING
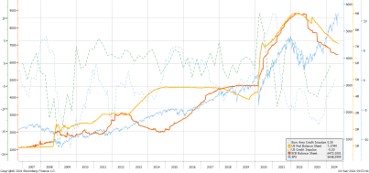
The above graph illustrates a recent decline in central bank balance sheets (orange and yellow lines) and Euro Area credit impulse (dotted lines), coinciding with steady upwards performance in equity markets (blue line). This suggests tightening monetary conditions and subdued economic growth have been surpassed by credit liquidity as an overall market driver.
PERFORMANCE
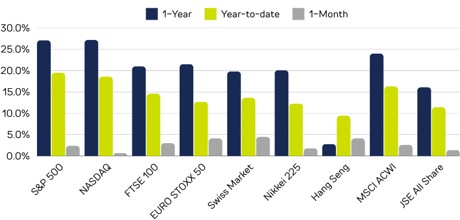
August provided positive equity returns around the globe. Year-to-date performance and rolling one year performance are also still in positive territory.
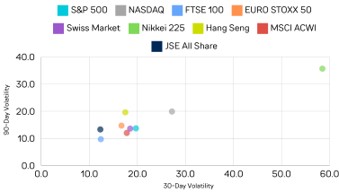
The above graph depicts a clustering of global equity markets with similar 30-day and 60-day volatility levels, mostly concentrated in the lower left quadrant, indicating lower volatility. A few outliers, particularly Japan suggest increased market instability or unique risk factors.

